
Task: Data graphic on the political topic
"Gun violence in the U.S."
"Gun violence in the U.S."
This interactive information graphic is intended to convey the situation of gun violence in the USA (in the period 2014 - 2020) in a simplified and clearly understandable way. The focus here is particularly on homicides in connection with firearms. Figures are deliberately omitted in order to present the user with an idea of the extent in a less abstract form.
Task: Visualising the process "climbing a mountain" using the example of Annapurna
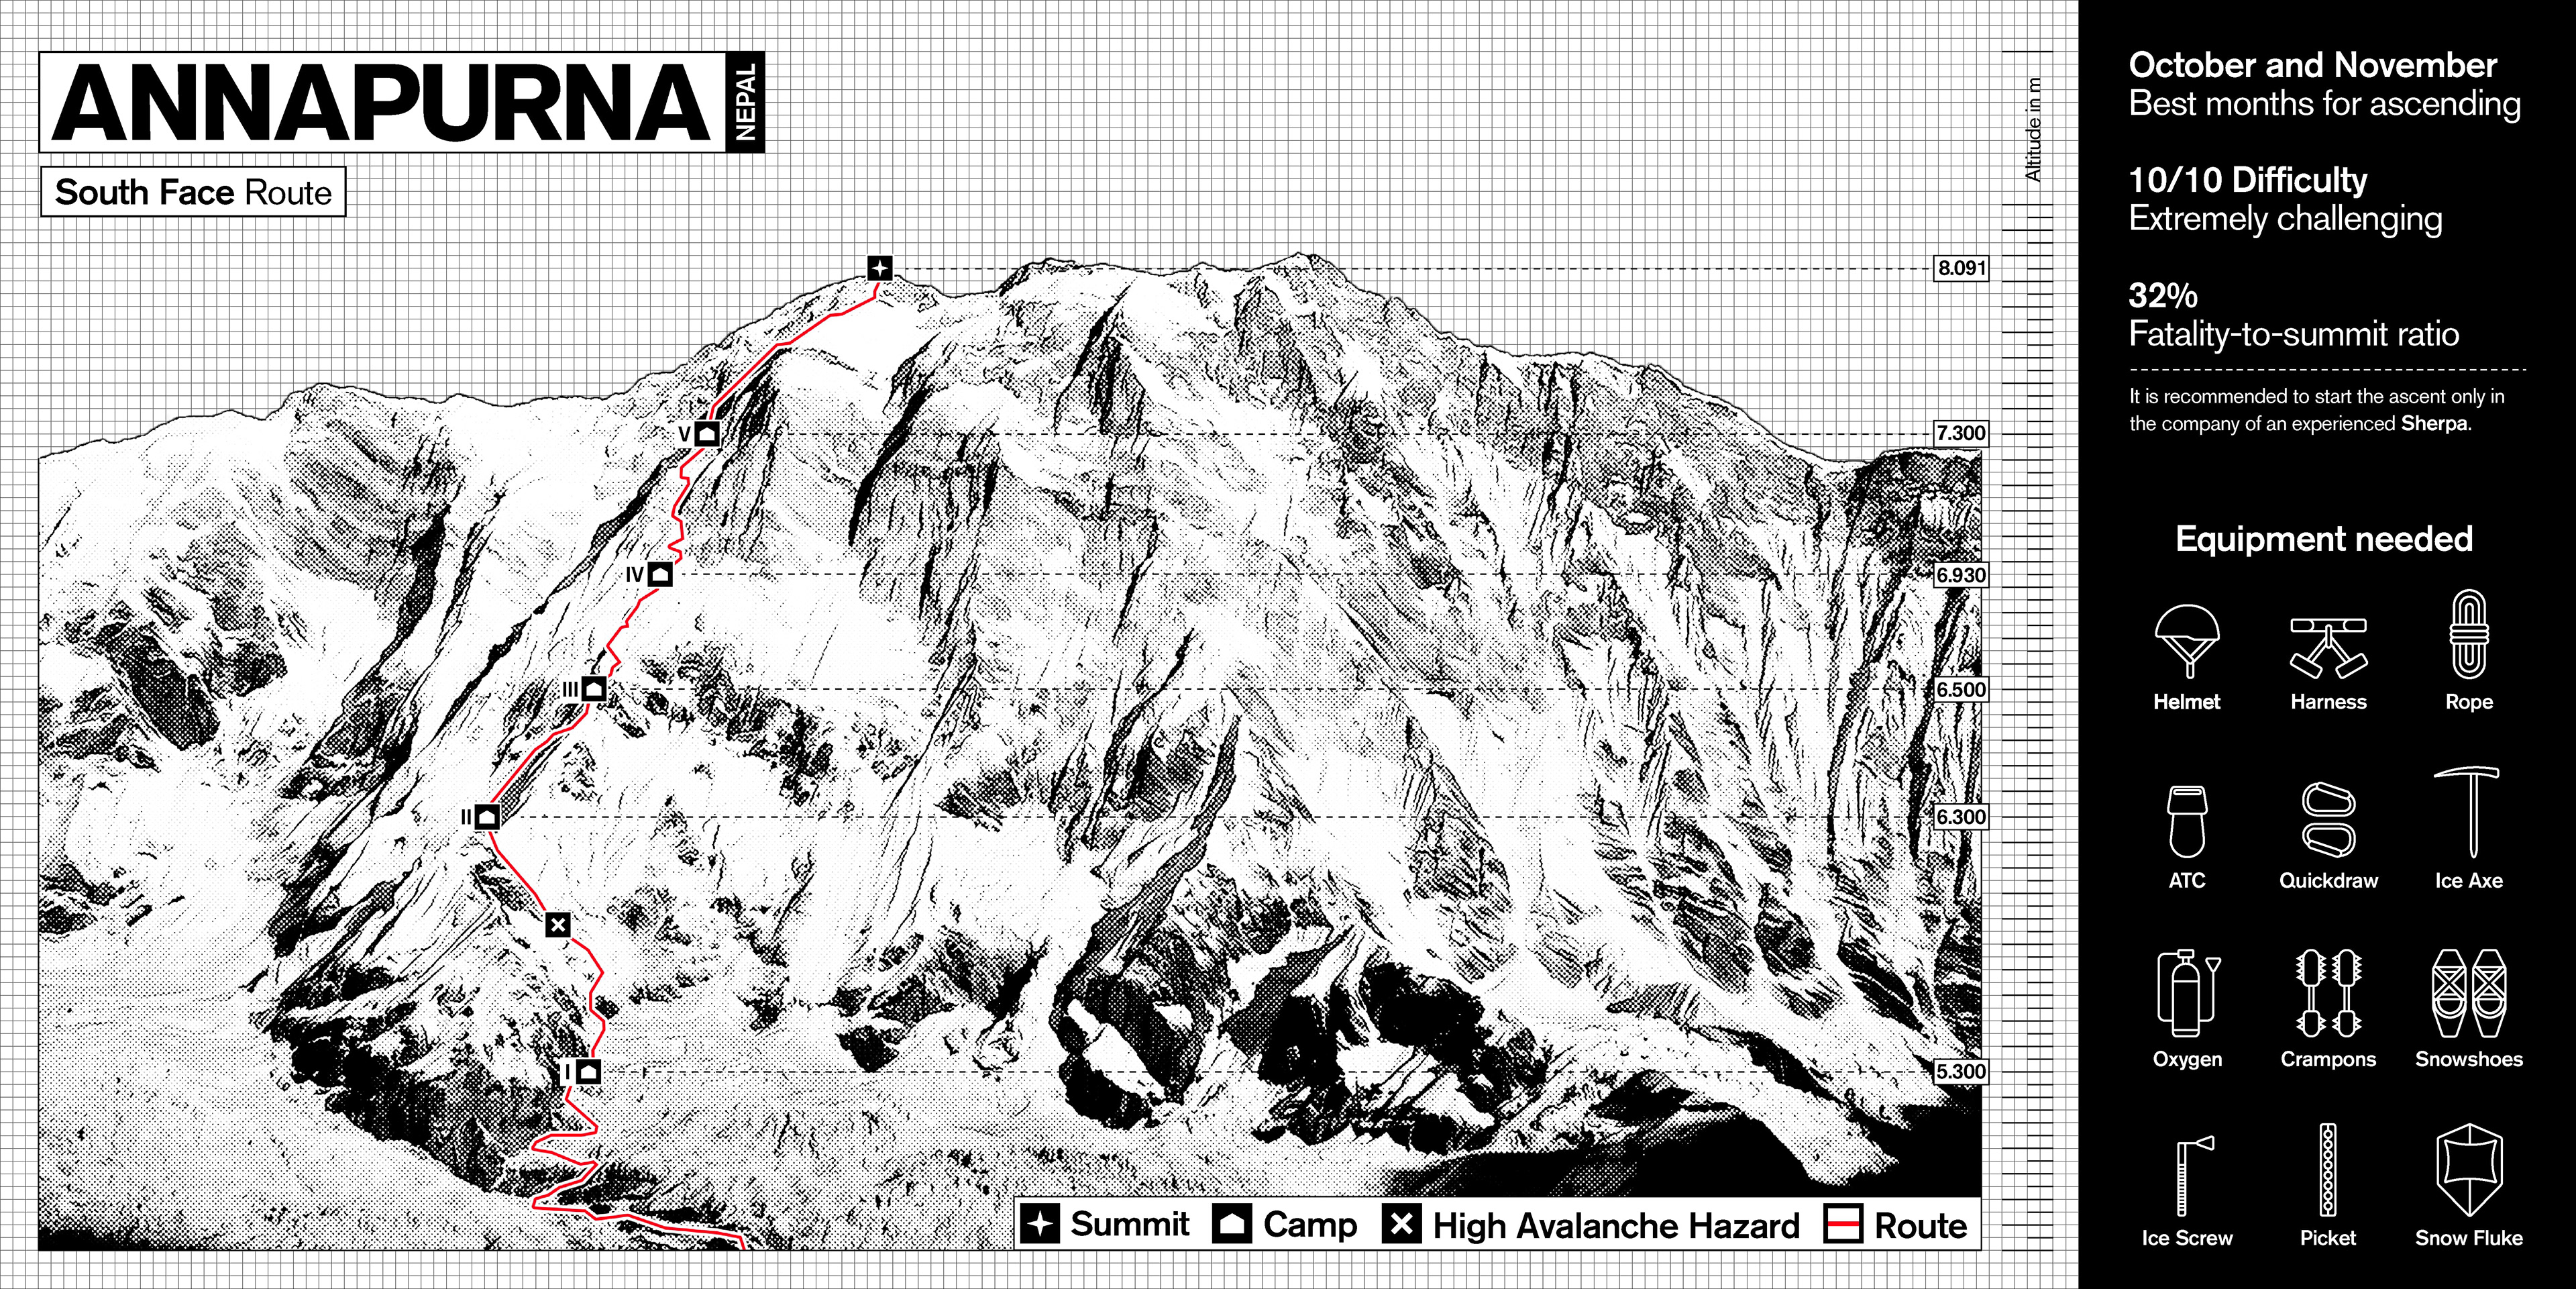
This information graphic is intended to provide the mountaineer with an easy-to-understand overview and a general, initial feeling for the mountain. Only the most essential information for the ascent is highlighted, as well as the route, hazardous areas and mandatory equipment. The graphic is also intended solely as a rough idea for the endeavour and is in no way a substitute for a professional mountain guide.